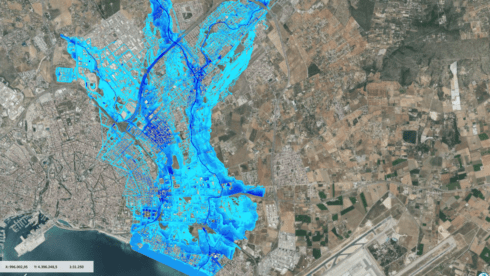
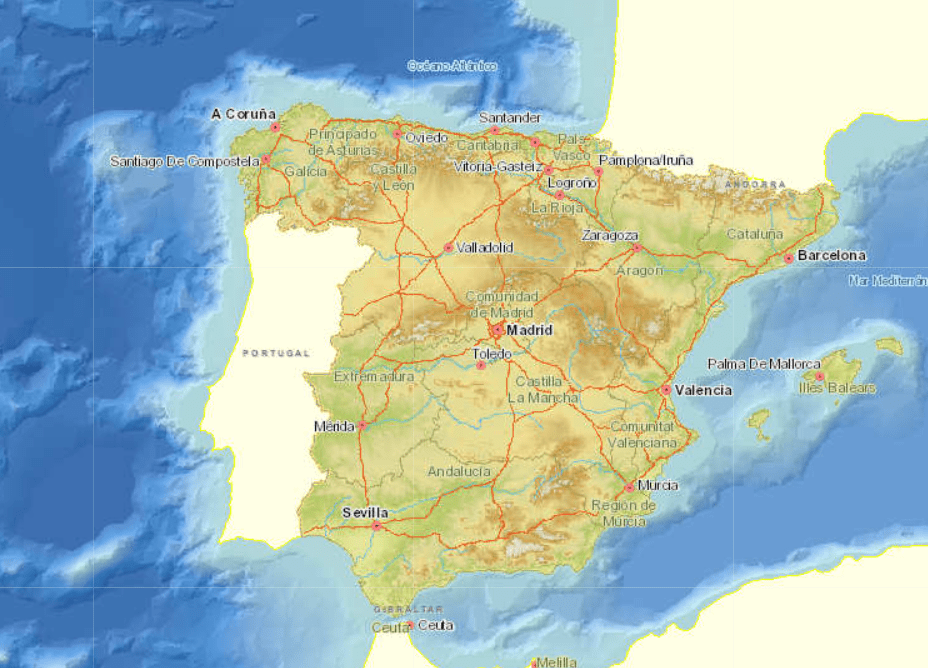
SPAIN’S Ministry for Ecological Transition has released an interactive map showing the areas most at risk of flooding.
Known as the Sistema Nacional de Cartografía de Zonas Inundables (SNCZI), it shows all the reservoirs, rivers and streams across the country, alongside their flood risk levels.

PHOTO: SNCZI
To find your home, you can use the SNCZI box on the left hand side and click on the ‘dph y zi’ tab.
Choose your region under the ‘Comunidad Autonoma’ section, followed by your province under ‘Provincia’.
Under the selection boxes, untick ‘dominio publico hidraulico’ and ensure ‘zonas inundables’ is selected.
Then click ‘buscar’ to get your results.
This will bring up a list of all the rivers and streams in your province which carry flood risks.
You can zoom in on the map to see these risk areas by scrolling in a northward direction.
Another way to assess your risk is by the ‘arbol de servicios’ tool in the bar at the top of the screen.
From there, there are many parameters you can choose but the most useful is the ‘cartografia zonas inundables de origen fluvial’, showing the areas at risk of flooding from rivers.
Choose ‘mapas de peligrosidad’ (danger maps) and add the three danger parameters: ‘Peligrosidad por inundacion fluvial T=10 años’ (risk of flooding every ten years), ‘peligrosidad por inundacion fluvial T=100 años’ (risk of flooding every one hundred years) and ‘peligrosidad por inundacion fluvial T=500 años’ (risk of flooding every 500 years).
To add these parameters, click the plus icon at the bottom right of the window.
The flood areas are marked by a blue tinge, to reset, simply reset the page.
Though issues are ‘unlikely’ in areas where the flooding is every 500 years, some of these areas were the ones affected in the Valencia tragedy.


